Many of the concepts we use in finance involve discounting risky cash flows using a discount rate appropriate for the level of risk associated with the investment. Investors will only hold risky securities or invest in risky projects if the expected rate of return on an investment is at least as much as the discount rate. This is because all investors are risk-adverse, that is, when they take on additional risk they expect to be compensated. This maxim is fundamental for an efficient market.
Therefore, in order to value a company's stock we need to find a way to measure its risk. Typically, we use variance or standard deviation to measure the risk of an individual stock. However, in the real world, investors hold more than one stock. When investors hold a portfolio of stocks, the risk of an individual stock becomes less important - what we really want to know is how an individual stock contributes to the overall risk of the portfolio. This is because the larger a portfolio is, the more an investor can diversify away her risk. As a result, most investors would want to diversify their portfolios as much as possible. Knowing this, we can imagine that an investor would expect a return from a security based on the level of risk each security contributes to a large portfolio. If we assume that each investor holds a very large portfolio, we can use the market portfolio in our calculation for the expected return of a stock. The market portfolio is a hypothetical portfolio consisting of every stock on a market.
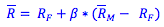
The capital asset pricing model tells us that an investor's expected return on a security is equal to the market's risk free rate of return (what the investor would expect to recieve as a return on a riskless investment such as a T-Bill) plus some amount of additional return the investor expects for investing in a risky stock, often called a risk premium. A stock's risk premium is equal to the risk premium of the market porfolio (expected return on the market portfolio minus the risk free rate) adjusted for or multiplied by the stock's Beta, which tells us how much risk the stock would contribute to a market porfolio. We can see from this formula that the Beta of the market portfolio itself is one, that a stock with a Beta less than one would require a smaller risk premium than the market portfolio, and a risky stock with a Beta of more than one would require a larger risk premium than the market portfolio.

Deriving The Capital Asset Pricing Model
The capital asset pricing model is derived from finding the expected return of an individual stock as well as its variance or standard deviation. Once we know a stock's variance or standard deviation, we can find its covariance or correlation with the expected return of other stocks or the market portfolio. To simplify these steps most students will be given a stock's Beta, which tells us how much the stock will move in response to movements in the market place and is a function of the stock and market's variance. By using Beta, the capital asset pricing model makes it easy for students to find the expected return of a stock if it was part of a large portfolio.
Expected Return (R̄): The rate of return that an investor expects a single stock to earn over the next period. This may be based on the average return of the stock in the past, a detailed analysis of the firm's prospects, a computer simulation, or inside information.
Variance (σ2) and Standard Deviation (σ): To find variance, we look at the deviation of a stocks actual return to its expected return. These deviations are squared, and then averaged to get the variance of a stock. Standard deviation is equal to the square root of variance. We can think of standard deviation as the standardized form of variance.
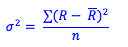
Where,
R = Actual return
n = number of states or observations
R - = deviation of a stocks actual return from its expected return
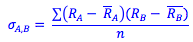
Covariance (σA,B): When we find variance, we look at the deviations of a stock's actual return from its expected return. To find covariance, we look at these same deviations. However, we know what to know how they relate to the deviations of another stock. To get the covariance, we find the product of the deviations of two stocks in each state. The average of these products is the covariance.
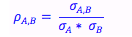
Correlation (ρA,B): The correlation is the standardized covariance. It is equal to the covariance divided by the standard deviation of each individual stock. Correlation is always between +1 and -1.
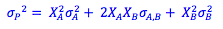
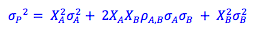
Variance of a two-stock portfolio (σP2): The variance of a portfolio consists of the variances of the individual securities, the covariance of the two securities, and the percentage of the portfolio made up by each security (XA and XB). A positive covariance will increase the variance of the entire portfolio. A negative covariance will reduce the overall risk of the portfolio. Creating a portfolio with securities that have a negative covariance so that they offset each other is known as a hedge. For a two-stock portfolio, we have the following variance:
Using Covariance:
Using Correlation:
We can extrapolate this to find the variance of the market portfolio. The capital asset pricing model suggests that the market portfolio is the only fund in which an investor needs to invest, along with an investment in a risk-free asset depending on the investor's tolerance of risk.
Beta: Beta measures the responsiveness of a security to movements in the market portfolio. We find beta by finding the covariance of the stock and market portfolio returns, and dividing this by the variance of the market portfolio.

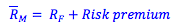
Expected return of the market: If an investor wanted zero risk, he could invest in a security such as a US Treasury Bill which offers a risk-free rate of return. Because investors are risk-adverse, when they invest in risky securities, they expect to be compensated for their risk with a rate return higher than the risk-free rate. As a result, we often represent the expected return on the market in the following form, where is the expected return on the market portfolio, and RF is the risk-free rate of return.
Expected return on an individual security: The beta of a security reflects the risk of a security as it relates to the market portfolio as a whole. Therefore, using beta we should be able to find the expected return of an individual security if we know the expected return of the market and the risk free rate. Where ( - RF ) = Risk premium. This is the capital asset pricing model (CAPM).
There is a positive linear relationship between the beta of a security and its expected return. The market portfolio has a beta of 1, and a stock with a beta of one would have the same expected return as the expected return of the market.
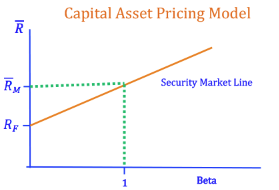
Photo by Sammie Vasquez on Unsplash
© BrainMass Inc. brainmass.com May 4, 2024, 11:55 am ad1c9bdddf